
Pgiam/iStock via Getty Images
Stock Snapshot
In picking a stock for today’s research note, I first had a look at Seeking Alpha’s handy key market data page which shows one sector in particular that catches my interest since I wrote extensively about it earlier this year and it is financial services, which has shown a nearly 8% YTD improvement.
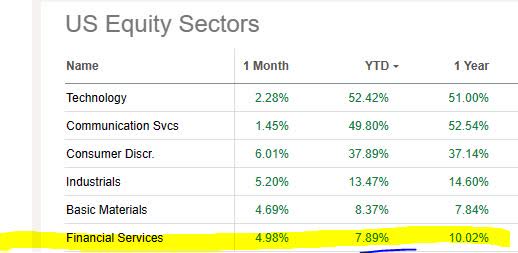
State Street – sector market data (Seeking Alpha)
That brings me to today’s focus stock, State Street Corp (NYSE:STT), which is one I last covered back in August when I gave it a strong buy. Since my rating the data shows that its price has gone up almost 10%.
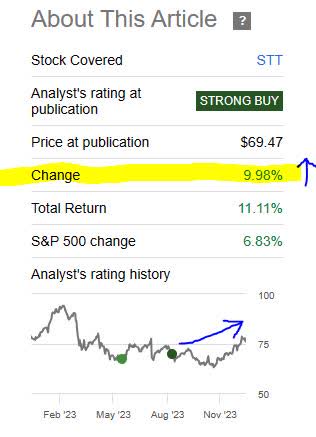
State Street – price since last rating (Seeking Alpha)
This time around I am giving it a 4 month review after its most recent earnings release and will apply my latest rating methodology to see if my prior rating has changed.
For readers less exposed to this company, here are a few quick facts about it from its profile page: It is a Boston-based financial group with roots dating back to 1792, is considered in the subsector of asset management and custodian banking, and has a diversified portfolio of institutional services however does not have a general consumer-banking element much like its custodian-banking peer Bank of New York Mellon (BK) doesn’t either.
Scoring Matrix
This article uses a 9-point scoring matrix that holistically considers multiple angles of the stock, with an emphasis on dividend-income potential for investors and fundamental trends from the key accounting statements such as the balance sheet and income statements, as well as a future-looking outlook on this stock.
I continue to test this methodology in my own portfolio, on stocks I don’t cover here, and it is my standard for building a long-term dividend-income portfolio that grows each year. So, I personally have a capital stake in this approach being successful.
Today’s Rating
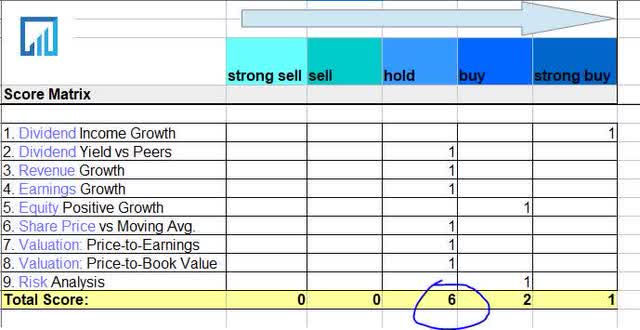
State Street – score matrix (author analysis)
Based on the score total in the score matrix above, this stock is getting a rating of hold.
This is a downgrade from my last rating which was more bullish.
Compared to the consensus rating on Seeking Alpha, my rating this time is in line with analysts and the quant system.
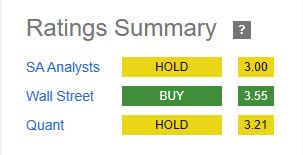
State Street – consensus rating (Seeking Alpha)
Dividend Income Growth
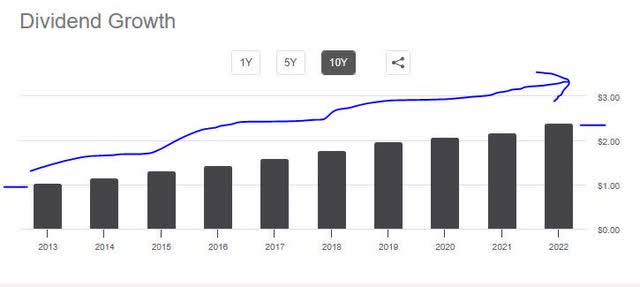
This section uses dividend growth data to explores the 10-year dividend income growth for a hypothetical investor owning 100 shares, to determine whether this stock is a great dividend income opportunity.
State Street – dividend growth (Seeking Alpha)
As an example, if I had acquired 100 shares in 2013 when the annual dividend was $1.04/share it would have generated $104/yr annual income, while by 2022 it would have been $2.40/share annual dividend ($240 income), which is a +130% growth over 10 years which is impressive.
We see from dividend history that for 2023 the annual dividend is up to $2.64, so the company continues on this growth streak which I think is great for a dividend investor.
I will call it a strong buy in this category on the basis of dividend stability, double-digit growth over a decade, and continued growth expected.
Dividend Yield vs Peers
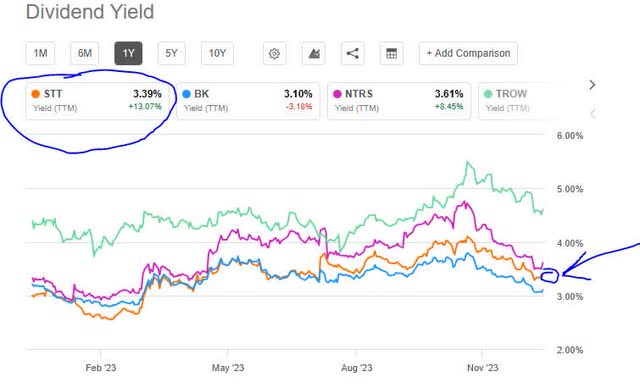
This section uses dividend yield data to compare the trailing dividend yield vs 2 or 3 similar peers in the same sector, to determine if this stock presents the most competitive dividend yield on capital invested.
State Street – dividend yield vs peers (Seeking Alpha)
In this exercise, I used the yield comparison tool from Seeking Alpha to compare my focus stock of State Street with three peers from the financial sector that I picked for having similar types of business lines.
Of this peer group, T. Rowe Price (TROW) led the pack with a dividend yield of 4.60%, while State Street came in 3rd place at a trailing yield of 3.39% (3.63% forward yield). Others compared with Bank of New York Mellon and Northern Trust (NTRS).
So, compared to peers I don’t think its quite a buy at this yield when I can do better with T. Rowe, however as a hold it makes sense especially considering the payout is $0.69/share and the next ex-date is coming up soon on Dec. 29th with a payout in early January.
Revenue Growth
This section explores this company’s revenue growth trends over the last year, using data from the income statement.
We can see from this data that revenue dropped in Q3 to $2.69B vs $2.95B in Sept 2022, an 8.8% YoY decline.
What we can also learn is that net interest income (NII) took a hit, as rising interest expenses seemed to offset the interest revenue. In fact, interest expense rose about 286% on a YoY basis, which is no small number.
Another impact to revenue was a $294MM loss on sales of investments and securities.
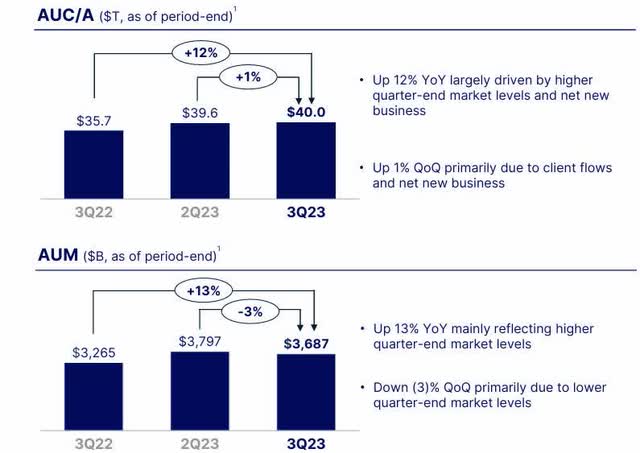
Looking forward, a firm like this cares about net money flows coming into the firm, since it earns fees on someone else’s money it looks after (to put it simply). The good news is that in their investment management shop they saw “AUM of $3.7T at quarter-end, with $10B of total net inflows, primarily driven by Cash.”
We can see from the graphic that assets under management and under custody have grown by double-digits on a YoY basis, partly because of net new business:
State Street – AUM/AUC (company q3 presentation)
In this case, I will call it a hold on the basis of revenue declines and interest rate margins getting squeezed, while at the same time positive growth in net new money into the firm, so my sentiment is middle-of-the-road in this case.
As far as “sustainability” of revenue going into 2024, keep in mind this firm was on the Financial Stability Board’s list of systemically critical banks in the world, and interest-rate risk should stabilize I think now that the Fed has hinted at reducing rates sometime in 2024. That ought to alleviate pressure eventually on interest expenses but could also mean interest income being lower too.
Earnings Growth
This section explores this company’s earnings (net income) growth trends over the last year, also using data from the income statement.
What this tells us is that in Q3 earnings declined to $422MM vs $690MM in Sept 2022, a +38% YoY decline.
We also see that since March 2022 there is no steady earnings growth trend but rather it appears lopsided, going up and down each quarter.
One item the company mentioned as an expense driver, according to their Q3 presentation, is higher comp and benefits:
Up 4% YoY mainly due to higher salaries, headcount and the impact of currency translation, partially offset by lower performance-based incentive compensation and contractor spend.
In addition, they saw expenses grow for technology, higher marketing spend, and increased real estate cost.
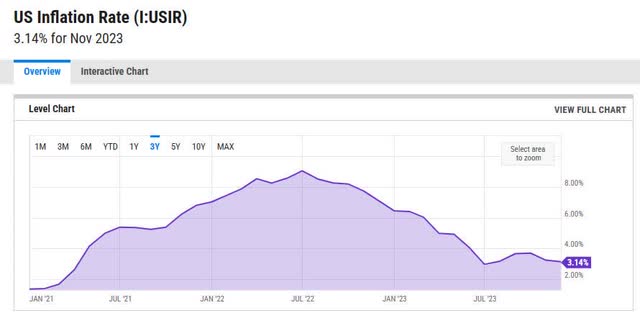
I am confident in the earnings sustainability of this company going forward as it has remained profitable throughout this entire inflationary period and the good news is that inflation is trending lower according to YCharts, which should alleviate those company costs impacted by inflation:
yCharts – inflation rate (yCharts)
In the earnings category, again I will call it a hold rather than a buy or sell, since earnings declined by double-digits however there is no longer-term declining trend but rather appears lopsided when you look at the income statement.
Equity Positive Growth
This section explores this company’s equity (book value) growth trends over the last year, using data from the balance sheet.
In this category, the company also saw a decline as total equity fell to $23.62B in Q3 vs $25.64B in Sept 2022, a YoY decline of 7.8%.
I also wanted to bring up something that caught my attention and that is a declining trend in the CET1 ratio at this bank.
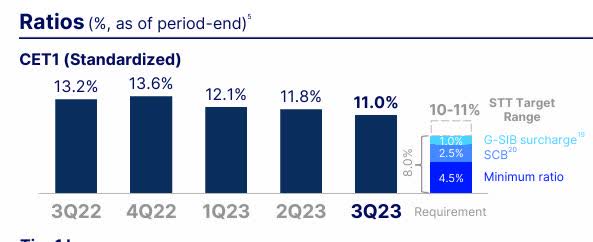
State Street – CET1 (company Q3 presentation)
We can see in the chart that although the CET1 (a key metric in the banking sector measuring capital strength) is well above regulatory minimums it has been on a declining trend at State Street since 3Q22, now down to 11% and just at the company’s own target range. Nothing to fret over, but something to think about, since I focus more on longer trends rather than one-time events.
I mention it to reassure readers the company still maintains capital strength and ability to return capital to shareholders. According to their Q3 comments, they “returned $1.2B of capital in 3Q23 consisting of $1B of common share repurchases and $213M of declared common stock dividends.”
In this category, therefore, I will call it a modest buy, on the basis of continued capital strength with a CET1 of at least 11% and continued ability to pay out dividends.
Share Price vs Moving Average
This section uses the YChart tool to explore the current share price compared to the 200-day simple moving average, to decide if it currently presents a buy, hold, or sell opportunity. The 200-day SMA is my standard long-term trend indicator I prefer for its simplicity and smoothing out the price movement.
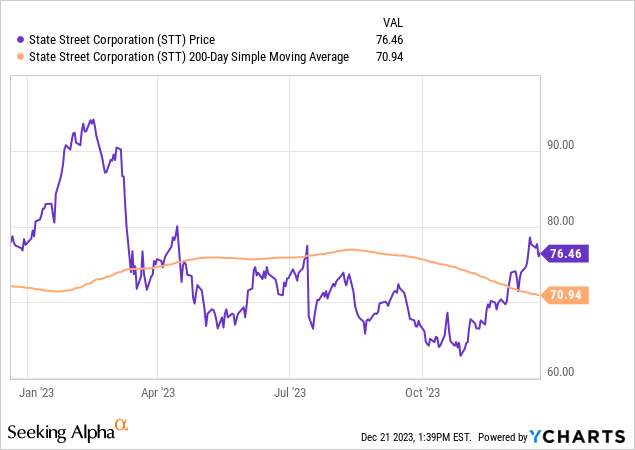
From the YChart above the data tells us that the current share price (as of this article’s writing) of $76.46 is quite up from the 200-day moving average. In fact, it is trending nearly +8% above the moving average.
This presents a great question since it is far below its January highs that stretched into the 90s, but is now over $10/share up from its autumn lows.
I will call it a hold in this case as I don’t think it is a great buy at this price considering the declines in revenue, earnings, and equity. At the same time, I would not sell yet if it was me because of the dividend income but also I think the financial sector will show some more upside.
It has already shown a 1 year sector improvement of +10% and this particular bank is not exposed to the kind of consumer-banking risks that some banks are such as increasing delinquencies and net charge-offs.
Valuation: Price-to-Earnings
This section uses valuation data to explore the forward P/E ratio and whether it presents an undervaluation opportunity or appears overvalued.
The current valuation data tells us the stock has a forward P/E ratio of 12.01, which is +10.2% above its sector average.
In tying back to the financials and share price already discussed, we know the share price has crept up above its average and that earnings have declined, so this seems to present an overvaluation scenario.
I would not call it a buy at this multiple and considering the other metrics but at 12x earnings not yet in sell range so I think a hold is fair. Now, if the earnings can catch up to the climbing share price it will present a much better valuation for a buyer.
Valuation: Price-to-Book Value
This section uses valuation data to explore the forward P/B ratio and whether it presents an undervaluation opportunity or appears overvalued.
In this case we have a forward P/B ratio of 1.07, vs a sector average of 1.19.
I will call it a hold here too because it is below the sector average but consider that equity has declined while the share price has risen above its moving average. If the equity were to improve and grow to catch up to the share price, we could see a better valuation here, instead of paying a 1.07x multiple for declining equity.
Risk Analysis
This section identifies a key risk to consider about this company and what its probability and impact could be to the business.
A risk I can identify with this type of firm is that a large chunk of its business relies on management fees based on percentage of assets it manages, so if equity values fall (for equity portfolios) or bond values fall on fixed-income assets then it could impact fees earned on those assets managed.
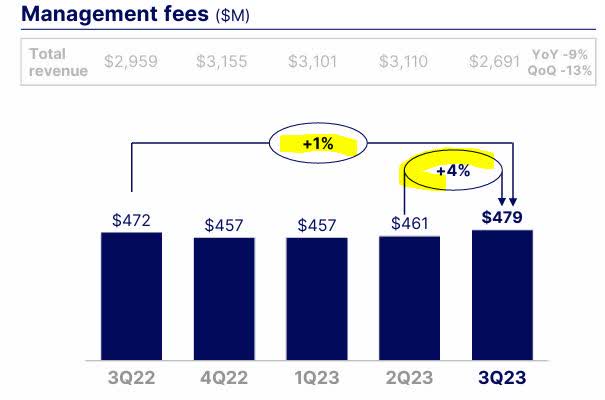
State Street – mgmt fees (company q3 results)
What we can see in the chart above is that management fees have increased on a QoQ basis which the company attributes to “due to higher average equity market levels.”
Correlating this to the S&P500 index performance in the last year, as a market trend indicator, we can see that the overall equity market has been on an improvement trend lately and now to close out the year:
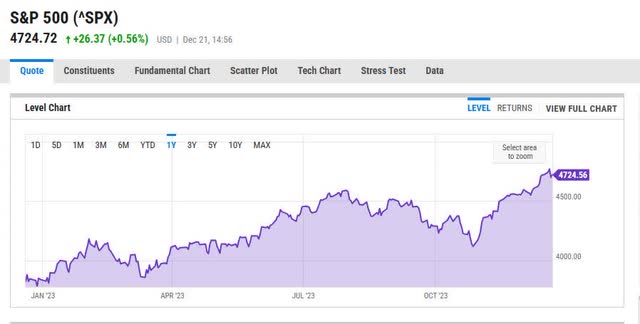
S&P500 performance (ycharts)
As far as going into 2024, my expectation is that equity markets will continue to improve in 2024 despite some lingering headwinds.
A point was made in a Dec. 19th CNBC article by Jay Hatfield of Infrastructure Capital Advisors, that supports this sentiment:
In short, Hatfield expects lower interest rates to make it easier for companies worldwide to receive financing and do business. Mixed with a resilient U.S. economy and a continuing boom in artificial intelligence, markets are likely to find themselves on an upward trajectory in 2024, he says.
So, I think the evidence points to this potential downside risk of declining equity markets being a low risk going into 2024, although certainly one to consider. I will call it a cautious buy in this category.
Quick Summary
To briefly summarize, today I am downgrading State Street to hold after another review using current metrics and although I think the great buying opportunity is behind us it is a great bank to hold onto as part of a diversified portfolio that earns regular quarterly dividends, if I was putting one together for myself, and to sit on it since I don’t think this bank who has been in business for over a century is going anywhere anytime soon.
Having grown up in the late 1980s across the river from Wall Street, I have over the decades seen many firms disappear or get absorbed into another firm. Firms like Dean Witter, Salomon Smith Barney, Lehman, Bear Stearns and many more were once a common sight on the Street back then but now are in the history books, while this one has survived.
If I had to place my capital in a major bank stock now, personally I would go for the one that was able to weather the storms for +100 years and still come back into port in one piece.

No comments:
Post a Comment